The Product Tanker Market
Analysis Creates Expertise
Trade Trends
In 2019, total seaborne oil products trade totalled an estimated 22.5 million barrels per day, equivalent to 9% of global seaborne trade in terms of tonnes, with volumes having expanded steadily overall in recent years (increasing from 20.2 million barrels per day in 2014 at a CAGR of 2.1%). However, the rate of growth in individual years has varied significantly during this period. Growth in seaborne oil products trade accelerated to over 7% in 2015, the fastest pace of growth since 2005, driven in part by the low oil price environment following the price crash in 2014 which encouraged oil demand growth and inventory building.
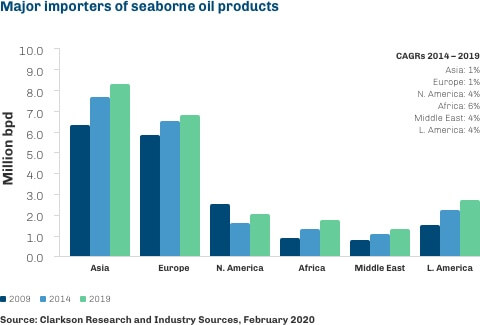
Import Trends
In recent years, key drivers of overall expansion in seaborne oil products trade have included increased imports into South East Asian/Asia Pacific, African and Middle Eastern countries. This is due to increasing oil demand in developing economies, many which lack sufficient domestic refinery capacity to meet this growth in demand. Weakness in the Mexican refining sector has also lent support to global growth in oil products trade, with imports into the country growing by a CAGR of 12.2% in 2013-18 as refinery utilisation fell. However, Mexican imports declined in 2019, in part due a government crack-down on fuel theft.
Refinery closures have also lent support to product import demand in some regions, for example in OECD Europe, where refining capacity has contracted by circa 0.8 million barrels per day since 2010. Whilst oil demand in this region has declined at an average rate of 0.4% p.a. in 2010-19, oil products imports have in fact expanded by a CAGR of 0.7% across the same period. Similarly, Australian oil products imports rose by a CAGR of 11% in 2010-18 according to customs data, supported in part by the closure of 0.3 million barrels per day of refinery capacity.
More recently, unfavourable arbitrage economics have exerted downward pressure on the pace of seaborne oil products trade growth. In 2019, South East Asian imports fell by 6% (total Asia down by 5% year-on-year) with oil demand growth in the region being limited, particularly in the first half of the year, by to a warmer winter, petrochemical outages and economic impact from US–China trade tensions. Preparations ahead of the IMO 2020 sulphur cap appear to have also impacted products trade volumes, with the run-down of HSFO inventories appearing to have exerted pressure on fuel oil trade volumes.
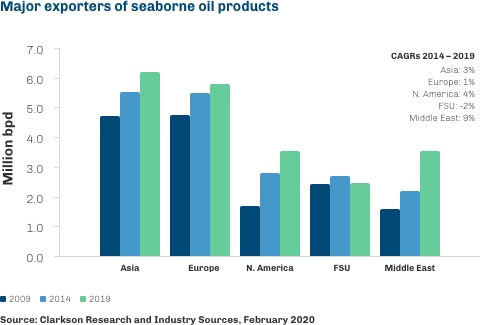
Export Trends
Much of the increase in exports in recent years has stemmed from increased shipments from the US, the Middle East and China. Exports from the US rose by a CAGR of 5.8% in 2013-18, supported by increased refinery capacity and also by the significant rise in domestic oil production, particularly shale oil, which led to higher availability of crude feedstock to refine. However, US products exports slipped 4% in 2019, partly owing to the closure of the 0.33 million barrels per day PES refinery on the USEC mid-year following a fire.
Meanwhile, Middle Eastern shipments expanded by a CAGR of 15.1% in 2013-18, due in large part to the construction of new refinery facilities in the UAE (Ruwais expansion, 0.4 million barrels per day) and Saudi Arabia (Jubail and YASREF, 0.4 million barrels per day each). However, significant declines in Saudi products exports in 2019, led to Middle Eastern products exports declining by an estimated 14% in 2019.
In the same period, Chinese seaborne products exports grew by a CAGR of 22.1% in 2014-19, also partly driven by significant expansion in refinery capacity (+1.4 million barrels per day) both at existing and new facilities, along with increased utilisation in the ‘teapot’ refining industry following the liberalisation of China’s oil market which allowed these independent refiners access to imported crude oil in late 2015 and to apply for products export quotas in 2016. As a result of these factors, China transitioned from a net oil products importer to a net oil products exporter during this period. In 2019, a rapid increase in Chinese oil products shipments of circa 14% (particularly gasoil), owing to the significant oversupply in the domestic market, largely supported the small increase in total Asian products exports in 2019 of circa 1%. However, this oversupply contributed to suppressed refining margins in Asia for much of the year, which along with increased global refinery maintenance to maximise production of middle distillates ahead of the 2020 sulphur cap exerted downwards pressure on seaborne products export volumes.

Product Tanker Trade Flow
Seaborne oil products trade in terms of tonnemiles is estimated to have increased by a CAGR of 2.5% in 2014-19. This pace is slightly faster than trade growth in tonnes as long-haul trade volumes have increased in recent years from countries that have only historically produced and exported crude oil, in particular from the Middle East to Asia and Europe. Increased exports from the US have also helped to support long haul trade, with growth on routes to the Far East and Brazil.
However, exports from the US have grown most significantly to closer Latin American countries, in particular Mexico, where refinery sector weakness has supported import demand. Growth on trades such as these has somewhat counterbalanced the positive impact on oil products trade growth in terms of tonne-miles at a global level, as has growth in intra-regional trade volumes in Asia. Continued growth at these historical levels will be subject to global economic developments and a continuation of the trade and refinery trends of recent years. In 2020, oil products tonne-mile trade is expected to increase by 3.9%, supported in part by positive impacts from the IMO 2020 sulphur cap on gasoil trade volumes, which is projected to boost exports from the US, Middle East & China.
Overall, growth in longer haul trade has lent support to demand for larger, LR vessels designed for longer haul trades as well as MR vessels, whilst growth on shorter-haul routes has provided positive impetus to demand for smaller tankers such as Handy vessels as well as MR vessels. MR vessels offer the flexibility of being sufficiently small to enable access to a diverse range of ports and are popular with oil traders given this flexibility and ability to deal with common parcel sizes.
Major seaborne oil products trade routes 2019

Source: Clarksons Research, February 2020